
Your cart is currently empty!


When selecting a solar water pump or DC pump, two key parameters always appear:
- Flow
- Head
However, many users do not fully understand the relationship between them.
In this article, we use Eiman pump performance data to clearly explain how pump performance works and how to choose the correct model.
1. What is Flow?
Flow represents the volume of water delivered by the pump per unit of time.
It is commonly expressed in two units:
- L/min (liters per minute)
- m³/h (cubic meters per hour)
Example conversion:
| L/min | m³/h |
|---|---|
| 50 | 3 |
| 100 | 6 |
| 150 | 9 |
| 200 | 12 |
Conversion formula:
1 m³/h = 16.67 L/min
Flow determines how much water you can move within a certain time period.
2. What is Head?
Head (measured in meters) refers to the maximum vertical height the pump can lift water.
In simple terms:
Head = Vertical distance between water inlet and water outlet
For example:
- A 20-meter deep well requires at least 20 meters of head.
- A rooftop water tank 15 meters high requires at least 15 meters of head.
The higher the head, the more pressure the pump must generate.
3. Key Principle: Higher Head = Lower Flow
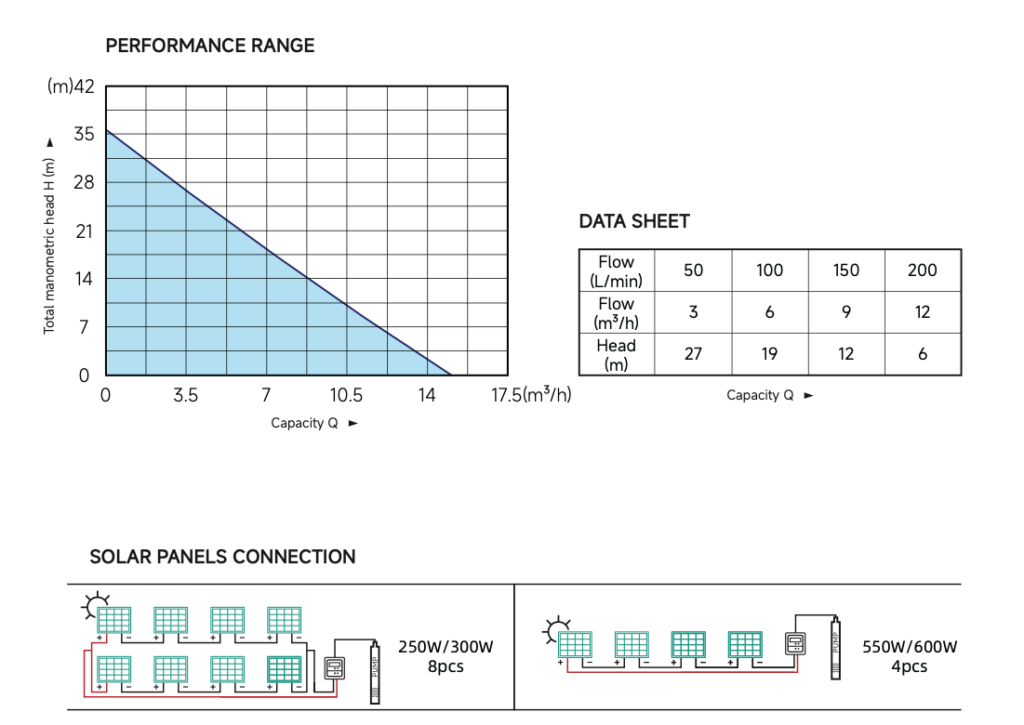
Based on Eiman performance data:
| Head (m) | Flow (m³/h) |
|---|---|
| 27 | 3 |
| 19 | 6 |
| 12 | 9 |
| 6 | 12 |
We clearly observe:
- At 27 meters head, flow is only 3 m³/h
- At 6 meters head, flow increases to 12 m³/h
This demonstrates a fundamental pump principle:
For a given pump power, head and flow are inversely related.
4. Why Does This Happen?
Pump output power can be simplified as:
Power ≈ Pressure × Flow
When head increases:
- The pump uses more energy to lift water higher.
- Less energy remains to push large water volume.
- Therefore, flow decreases.
Simply put:
With the same motor power, a pump can either lift water higher or move more water — but not both at maximum simultaneously.
5. How to Read the Performance Curve
In the pump performance graph:
- X-axis: Flow (m³/h)
- Y-axis: Head (m)
- The downward-sloping line: Pump working performance
Typically:
- Upper left area → High head, low flow
- Lower right area → Low head, high flow
Every point on the curve represents a possible operating condition of the pump.
6. How to Select the Right Pump
Step 1: Calculate Total Required Head
Include:
- Vertical lifting height
- Pipe friction losses
- Valve losses
- Safety margin
Step 2: Determine Required Flow
Examples:
- Agricultural irrigation → High flow
- Deep well pumping → High head
- Water storage tank supply → Medium head
Step 3: Match the Operating Point
Choose a pump that can provide your required flow at your required head.
7. Solar Panel Configuration Considerations
The system diagram shows two solar configurations:
- 250W / 300W × 8 panels
- 550W / 600W × 4 panels
Solar power affects:
- Starting voltage
- Maximum output power
- System efficiency
If solar power is insufficient:
- Actual head will decrease
- Actual flow will decrease
Therefore:
Solar panel power must properly match pump rated power.
8. Conclusion
✔ Higher head results in lower flow
✔ Pump performance curves define the operating range
✔ Proper pump selection depends on real installation conditions
✔ Solar power matching is critical for system performance
If you are unsure which model suits your project, contact the Eiman technical team for professional selection support.
Leave a Reply